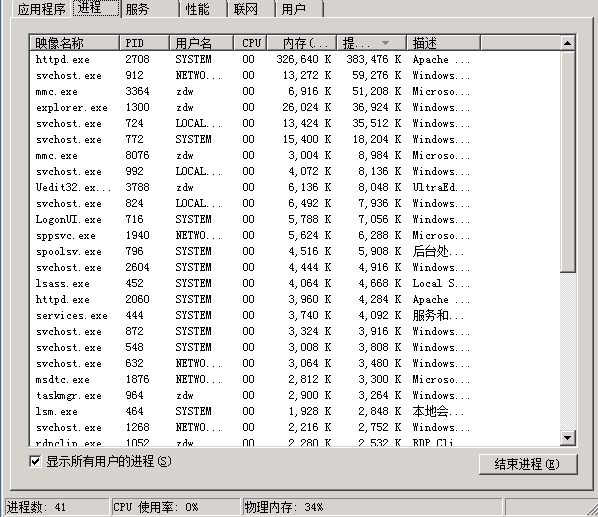
硬件配置与前文相同
windows版本为2008 R2,新装,没更新。
Apache参数
<IfModule mpm_winnt_module>
ThreadsPerChild 1900
MaxRequestsPerChild 0
</IfModule>
先来看看IIS+PHP的性能吧,你的信仰可能要崩塌了:
Server Software:        Microsoft-IIS/7.5
Server Hostname:        api.tingtao.org
Server Port:            80

Document Path:          /test.php
Document Length:        79246 bytes

Concurrency Level:      1000
Time taken for tests:   67.775 seconds
Complete requests:      10000
Failed requests:        382
   (Connect: 0, Receive: 0, Length: 382, Exceptions: 0)
Total transferred:      794109618 bytes
HTML transferred:       792459618 bytes
Requests per second:    147.55 [#/sec] (mean)
Time per request:       6777.488 [ms] (mean)
Time per request:       6.777 [ms] (mean, across all concurrent requests)
Transfer rate:          11442.26 [Kbytes/sec] received

Connection Times (ms)
              min  mean[+/-sd] median   max
Connect:        0    7   9.9      6     430
Processing:    35 6499 1235.8   6749    9678
Waiting:        5 3345 1990.3   3267    6758
Total:         38 6506 1235.8   6755    9684
我也承认,吓到我了,于是又测了一次:
Server Software:        Microsoft-IIS/7.5
Server Hostname:        api.tingtao.org
Server Port:            80

Document Path:          /test.php
Document Length:        79246 bytes

Concurrency Level:      1000
Time taken for tests:   67.474 seconds
Complete requests:      10000
Failed requests:        308
   (Connect: 0, Receive: 0, Length: 308, Exceptions: 0)
Total transferred:      794109678 bytes
HTML transferred:       792459678 bytes
Requests per second:    148.21 [#/sec] (mean)
Time per request:       6747.386 [ms] (mean)
Time per request:       6.747 [ms] (mean, across all concurrent requests)
Transfer rate:          11493.31 [Kbytes/sec] received

Connection Times (ms)
              min  mean[+/-sd] median   max
Connect:        0    7   3.6      6     108
Processing:    48 6413 1179.6   6737    8068
Waiting:        5 2199 1346.8   1994    6556
Total:         50 6419 1179.6   6744    8074

Percentage of the requests served within a certain time (ms)
  50%   6744
  66%   6749
  75%   6750
  80%   6751
  90%   6753
  95%   6867
  98%   7049
  99%   7082
 100%   8074 (longest request)
而且带宽是跑满的,而且我连驱动都没装,而且我还想起来,我还没用内存盘……
然后看看静态文件能力:
Server Software:        Microsoft-IIS/7.5
Server Hostname:        api.tingtao.org
Server Port:            80

Document Path:          /test.txt
Document Length:        138819 bytes

Concurrency Level:      1000
Time taken for tests:   164.262 seconds
Complete requests:      10000
Failed requests:        0
Total transferred:      1390660000 bytes
HTML transferred:       1388190000 bytes
Requests per second:    60.88 [#/sec] (mean)
Time per request:       16426.239 [ms] (mean)
Time per request:       16.426 [ms] (mean, across all concurrent requests)
Transfer rate:          8267.66 [Kbytes/sec] received

Connection Times (ms)
              min  mean[+/-sd] median   max
Connect:        0   16 142.9      7    2778
Processing:   112 16048 1428.0  16406   25049
Waiting:        9 3162 1910.7   3147    7620
Total:        118 16064 1443.9  16413   25553

Percentage of the requests served within a certain time (ms)
  50%  16413
  66%  16421
  75%  16445
  80%  16449
  90%  16466
  95%  16475
  98%  16556
  99%  17109
 100%  25553 (longest request)
不出意外,效率很不错。
下面看看Apache了。
静态文件:
Server Software:        Apache
Server Hostname:        api.tingtao.org
Server Port:            80

Document Path:          /test.txt
Document Length:        138819 bytes

Concurrency Level:      1000
Time taken for tests:   158.955 seconds
Complete requests:      10000
Failed requests:        3
   (Connect: 3, Receive: 0, Length: 0, Exceptions: 0)
Total transferred:      1390570000 bytes
HTML transferred:       1388190000 bytes
Requests per second:    62.91 [#/sec] (mean)
Time per request:       15895.509 [ms] (mean)
Time per request:       15.896 [ms] (mean, across all concurrent requests)
Transfer rate:          8543.16 [Kbytes/sec] received

Connection Times (ms)
              min  mean[+/-sd] median   max
Connect:        0   15  96.8      6    3004
Processing:   340 15365 3715.8  15563   26677
Waiting:        2 2494 2212.3   1523   10700
Total:        348 15380 3717.9  15809   26684

Percentage of the requests served within a certain time (ms)
  50%  15809
  66%  16726
  75%  17159
  80%  17459
  90%  18427
  95%  19055
  98%  23515
  99%  26047
 100%  26684 (longest request)
测试了2次,结果基本一样,带宽一样跑满。
php:
Server Software:        Apache
Server Hostname:        api.tingtao.org
Server Port:            80

Document Path:          /test.php
Document Length:        60888 bytes

Concurrency Level:      1000
Time taken for tests:   163.956 seconds
Complete requests:      10000
Failed requests:        1812
   (Connect: 0, Receive: 0, Length: 1812, Exceptions: 0)
Non-2xx responses:      954
Total transferred:      552428140 bytes
HTML transferred:       551077118 bytes
Requests per second:    60.99 [#/sec] (mean)
Time per request:       16395.638 [ms] (mean)
Time per request:       16.396 [ms] (mean, across all concurrent requests)
Transfer rate:          3290.39 [Kbytes/sec] received

Connection Times (ms)
              min  mean[+/-sd] median   max
Connect:        0    1   1.6      1       9
Processing:    10 14249 21204.2   3040   64303
Waiting:        3 14130 21228.5   3005   64132
Total:         10 14250 21204.0   3041   64304

Percentage of the requests served within a certain time (ms)
  50%   3041
  66%  10028
  75%  19429
  80%  27263
  90%  62243
  95%  64043
  98%  64086
  99%  64098
 100%  64304 (longest request)
php也是测试了2次。
行吧,最终结果大致就这样了,连我都没想到,IIS完爆其他对手……
然后我想起来在2008发布的时候ms吹牛B说fastcgi在2008上面效率高于对手50%,当时我记得自己也测试过,结论也差不多,所以并不能认为人家是在吹牛B。只是没想到不仅仅是50%这么简单,直接翻倍了……
这几次的测试,首先win平台是很老的系统版本,主要是因为这渣渣机器运行新版系统我估计要崩……
接着呢,win平台我忘记要把文件放在内存里了,所以文件系统效率应该会低一些。
然后win平台的php都是最新版,而ubuntu的是7.4.3,FB的是7.4.8,这个可能会略有差异,但我估计主版本相同,应该差别不大。
最后,暴力优化过的Apache,用内存300多M,有点暴力:

